

“The name’s Graphic… Info Graphic.” Bad Bond jokes aside, infographics are a great way to convey complex information in an easy-to-read format. Image by Affinity Magazine.
We have all had the experience of trying to follow a long list of directions with no pictures and processes not broken up into simple steps. It’s frustrating! We can’t be sure if we pushed the right button, tightened the right screw or if the language setting is correct! The same principle applies to your business. If your customers can’t understand a process quickly and with little outside assistance they will simply get frustrated and move on.
Infographics serve a variety of purposes – Let’s discuss what they do and the impact they have on brand and customer interaction.
Share detailed information and processes
Make it a priority to inform your customers about your industry. Have a complicated industry with specialized terms? Define them and use real-life applications to explain their use.
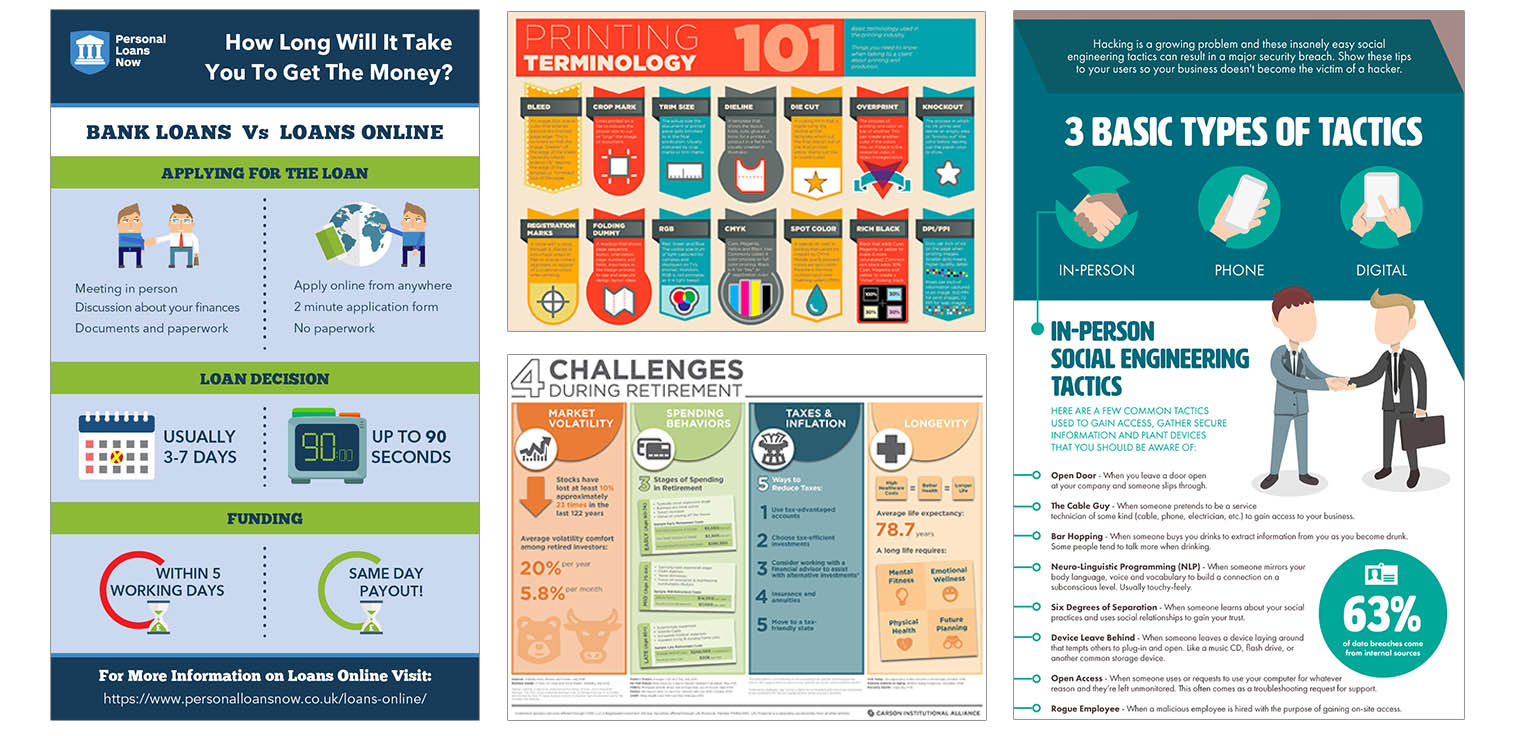
Infographics allow you to show comparisons, pros and cons and step-by-step processes. Sources for each infographics are listed at the end of the post.
Showcase your brand
The design and layout of each and every infographic should be representative of your brand, including colors, type, voice and images. Voice refers to the way your company uses language to communicate. Institutions like banks or federal agencies opt for more formal language while companies like MailChimp use a conversational and humorous tone.

Images can have variety while still recognizable as your brand by use of color, image and illustration.
Simplify data
Companies are turning to image based representations of data. Annual reports, for example, have been redefined to be engaging and dynamic while showing sales and figures. If your company works with large amounts of data, break up the information with colors, images and icons that convey the message.
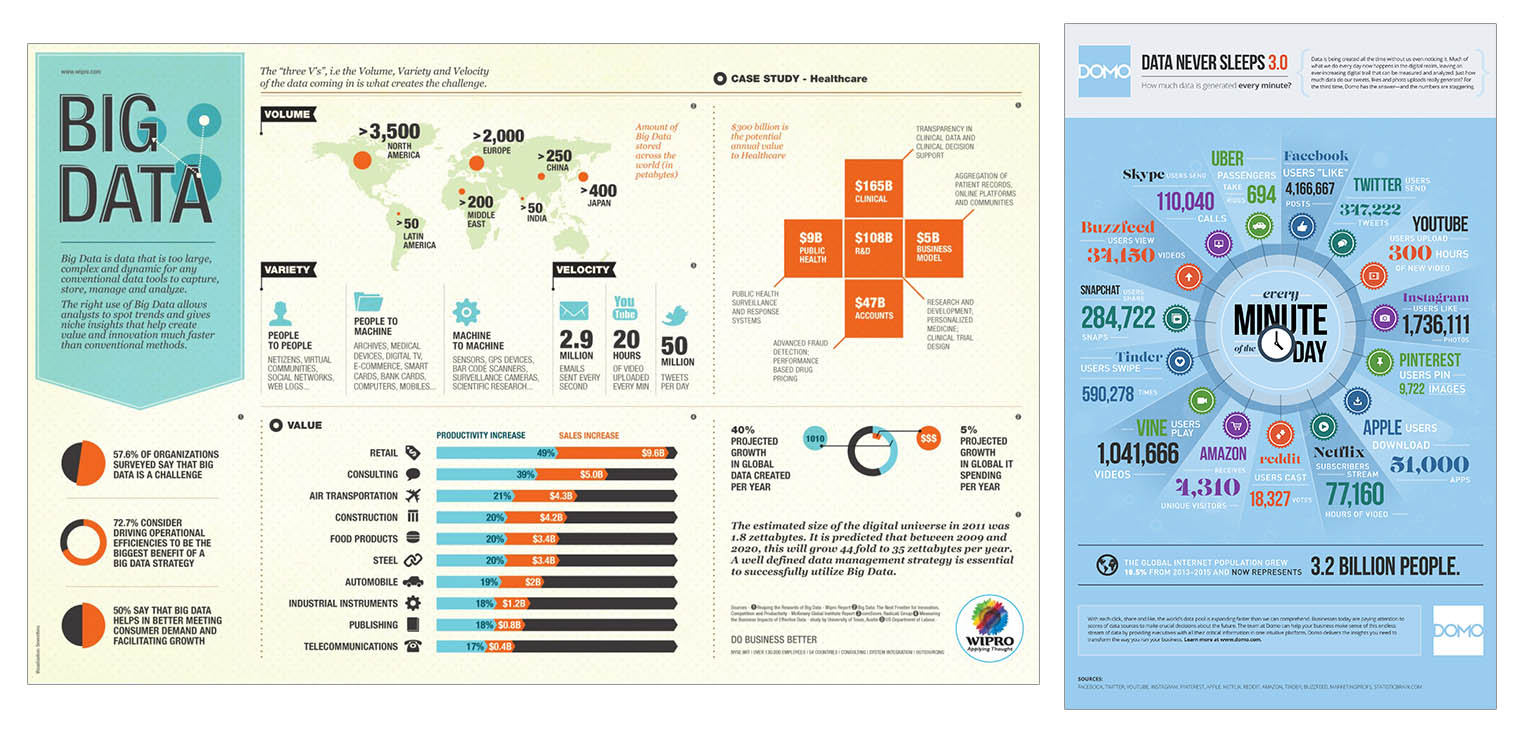
When conveying large amounts of data, it is important to show a variety of visual representations. This can include bar graphics, pie charts, maps and circle graphs.
The best part about infographics? They are shareable! If customers find your images helpful and informative they will share them on their social media channels and websites. Be intentional about adding your website URL and logo to each piece.
As your image is shared, you will be associated with quality content and fine-tuned branding!
Author, Laura V. Boston
The C3 Group
Sources
Detailed information and processes – Left, middle (top), middle (bottom), right
Showcase your brand – FedEx